Body charting is recording a client's symptoms on an outline drawing of the human body, so the location, spread, and type of each symptom sit in the record as a picture. The standard form is a line drawing with front and back views, where the client shades the areas they feel pain or marks them with colors or symbols (Persson et al., Journal of Pain Research). The same research describes pain drawings as a tool for the assessment, diagnosis, and documentation of pain conditions.
This guide gives you a template layout to copy, five worked examples from chiropractic, massage therapy, functional medicine and naturopathy, nutrition, and mental health, and the steps to build your own chart into your notes.
Every example here is illustrative. The clients are composites written to show the format, and none is a real person or a real record.
A body map is two outlines of the body, front and back, side by side on one page, with a legend in the margin and space for notes. The client or practitioner marks the outlines, and the legend tells the reader what each mark means.
Here is the layout this guide uses. Copy it as is, or adjust the views and legend to your work.
| Area of the chart | What goes there |
|---|---|
| Header | Client name, date, visit type, and who marked the chart |
| Front and back outlines | The marks themselves |
| Legend | One symbol per sensation, printed on the page |
| Color key | Client marks in one color, your findings in another |
| Intensity column | A 0 to 10 rating beside each marked area |
| Behavior column | Constant or comes and goes, plus what makes it better or worse |
| Linked note | The session note the chart belongs to |
Side views, hands, feet, and the face are optional extra outlines. Add them when your work involves those areas in detail. Empty outlines invite guessing.
Four things go on a body chart: where the symptom is, what it feels like, how strong it is, and how it behaves. The outline handles location. The legend handles the type of sensation. The two columns handle intensity and behavior.
A legend you can start from:
| Symbol | Meaning |
|---|---|
| Solid shading | Aching or dull pain |
| Dots | Numbness |
| Zigzag lines | Pins and needles or tingling |
| X | A specific tender point |
| Arrow | Symptom spreads in this direction |
| Tick mark | Area checked and clear |
The tick mark is the symbol we would argue for hardest. A tick over the leg tells the next reader you asked and the client said it was clear. Without it, a blank leg could mean either.
Whatever legend you pick, use it the same way for every client. A chart is only readable at a later visit, or by a colleague, when the symbols mean the same thing every time.
Each example below shows the scenario, what was marked on the chart, and the line in the session note that goes with it. The chart shows where. The note says what it means.
Composite scenario: first visit, lower back pain for six weeks.
Client marks (blue): solid shading across the right lower back. An arrow from the right buttock down the back of the right thigh, stopping above the knee. Zigzag lines on the outer right thigh.
Practitioner marks (red): an X over a tender point at the right side of the lower back. Tick marks over the neck, both arms, and the left leg.
Intensity and behavior: lower back 6 out of 10, constant. Thigh 4 out of 10, comes and goes, worse after sitting through a long drive.
Note line: "Body chart attached. Client-marked areas in blue, examination findings in red. Thigh symptoms reported as intermittent and linked by the client to prolonged sitting. Left leg, arms, and neck checked and clear."
The arrow and the stopping point matter here. Where a spreading symptom ends is a detail that is easy to lose in a written note and hard to lose on a drawing.
Composite scenario: returning client, booked for a 60-minute session.
Client marks (blue): circles over both upper shoulders and the left shoulder blade, labeled "work here." A crossed-out area on the right shin, labeled "avoid, bruised."
Pressure preference (written beside the outline): firm on the back, light on the neck.
Practitioner marks (red, after the session): shading over the areas worked. A note beside the left shoulder blade with the client's feedback during the session.
Note line: "Pre-session chart from client, post-session marks added. Right shin avoided at client request. Client reported the left shoulder blade area felt easier by the end of the session."
For a massage practice, the chart does two jobs. Before the session it is the client's instructions. After the session it is your record of what you did, in the same picture.
Composite scenario: joint pain and a skin rash, compared across a first visit and a review visit.
| First visit | Review visit | |
|---|---|---|
| Hands | Shading over three finger joints on each hand | Shading over one finger joint on each hand |
| Right knee | Solid shading, 5 out of 10 | Solid shading, 5 out of 10 |
| Forearms | Dotted outline of a rash on both forearms | Smaller outline on the left forearm only |
Note line: "Review chart compared with first-visit chart. Fewer painful finger joints marked by the client on both hands. Knee unchanged. Rash area reduced and now marked on the left forearm only."
This is where body charting pays off for practices that see clients over months. Two charts side by side show a change the client can see for themselves, and that makes the review conversation concrete. If symptoms in several body systems are part of your intake, a chart puts them on one page.
Composite scenario: digestive symptoms, second visit.
Client marks (blue): shading over the upper abdomen labeled "bloating, afternoons." A circle over the lower left abdomen labeled "cramping, mornings."
Intensity and behavior: bloating 5 out of 10, comes and goes. Cramping 3 out of 10, comes and goes.
Note line: "Abdominal body chart attached. Two distinct areas and timings marked by the client. Compare against the client's food journal for the same two weeks before the next visit."
A body chart and a food journal answer different questions. The chart records where and when a symptom shows up, and the journal records what was eaten. Putting them side by side is how you look for a pattern. If you already use a journal with clients, tracking client progress with a food and mood journal covers how to set one up.
Composite scenario: a client working on anxiety around presenting at work.
Client marks (blue): shading over the chest, throat, and stomach, drawn while describing the morning of a recent presentation.
At session six (green, on a fresh outline): shading over the chest only, lighter.
Note line: "Client completed a body map of where they notice anxiety before presenting. Repeated at session six. Client marked a smaller area and described it as less intense."
Asking people to color in where they feel something on a body outline is also a research method. A study published in PNAS had 701 participants color body silhouettes to show where they felt activity increase or decrease during different emotions (Nummenmaa et al., Bodily maps of emotions). If your approach includes somatic work, the same outline gives clients a way to show you what they find hard to put into words.
You build a body chart template in six steps: choose your views, write a legend, decide who marks first, add intensity and behavior fields, attach the chart to the session note, and compare charts at each review.
The written note still carries the reasoning. If you chart in SOAP, the body chart supports the subjective and objective sections, and the assessment explains what the marks add up to. For worked notes in that format, see SOAP note examples, and for the mechanics, how to write a SOAP note.
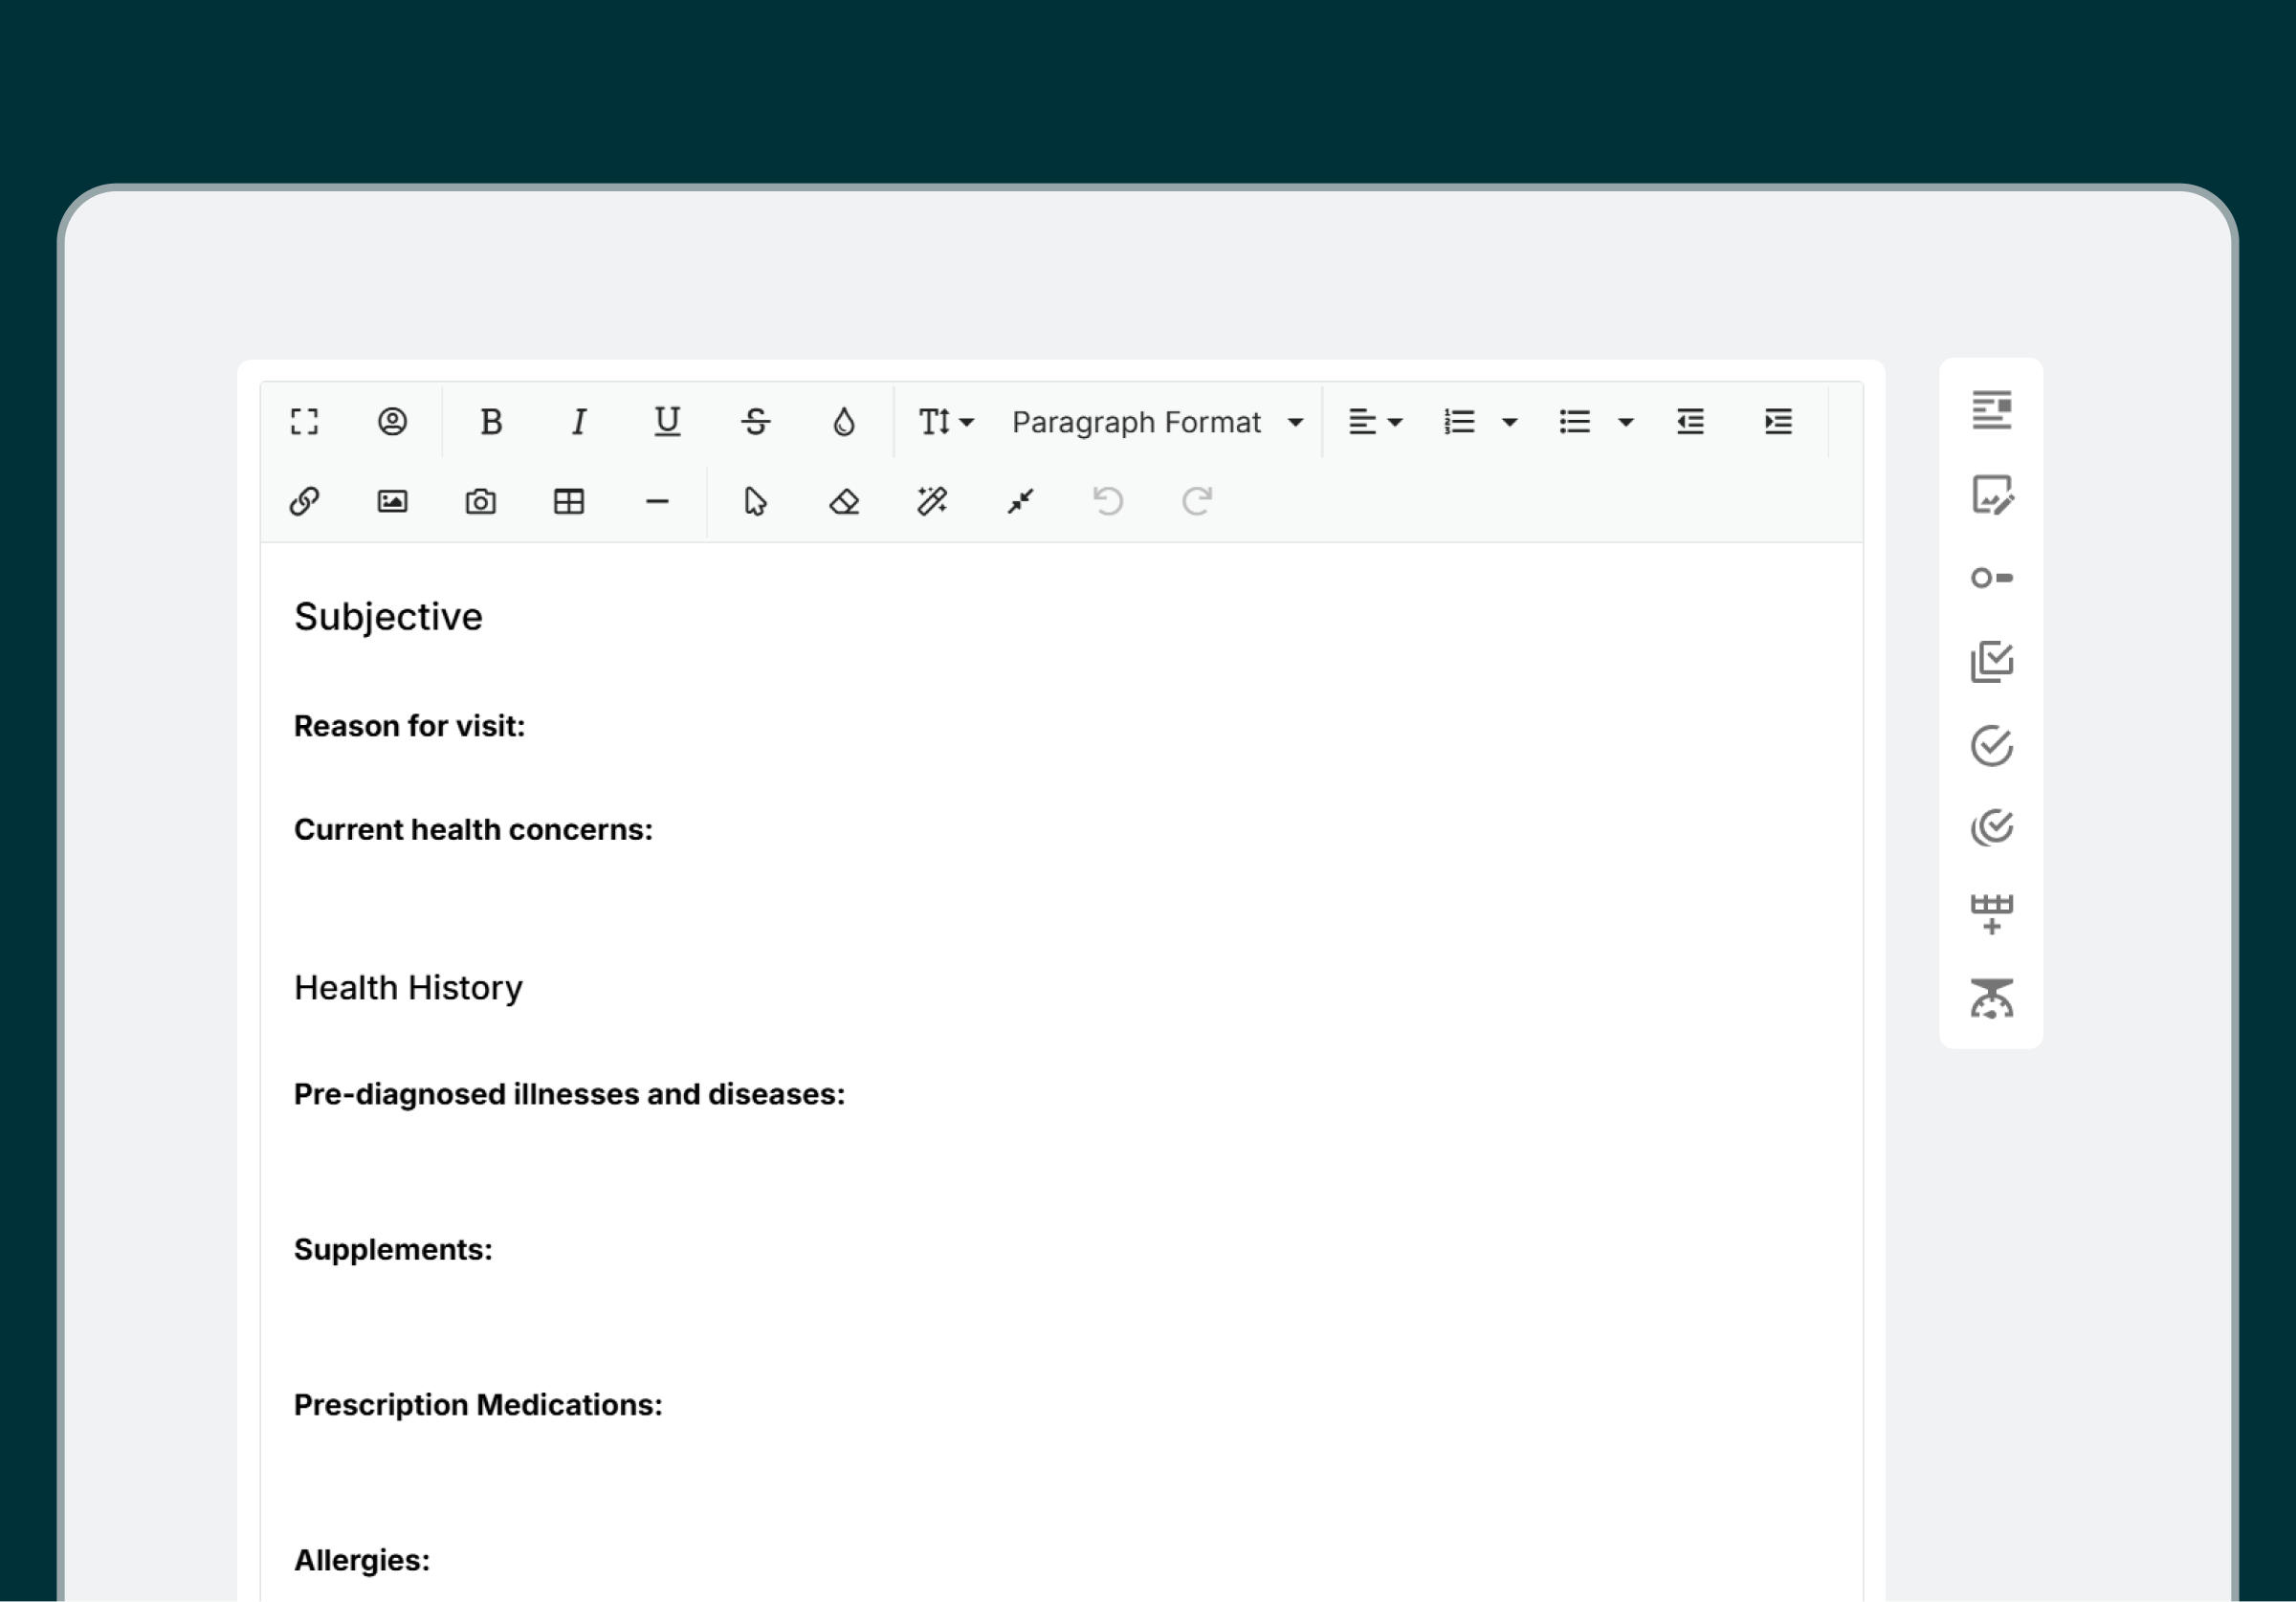
You body chart in Practice Better by adding a body diagram image to the client record and marking it up with Image Annotation. The feature lets you make notes directly on any image you add to client records, using a toolbar to mark up areas, add measurements, draw, and take notes you can refer back to (top time-saving features). Practice Better also lists marking up diagrams, scans, or charts in your session records among its features (what we've built together).
The chart then sits inside the same record as the rest of your documentation. Practice Better's charting tools support SOAP, ADIME, DAP, BIRP, or a custom note format built from scratch, and let you attach protocols, labs, and tasks directly to session notes. Its template library is searchable by profession and by format, and every pricing plan includes full access to the form and note templates. For setting up the note side, how practitioners unlock note templates walks through it.
You will see them called body charts, body diagrams, body maps, and pain drawings. Pain drawing is the term pain researchers use (Persson et al.), and body map is the term used in research on where people feel emotions in the body (Nummenmaa et al.). They all describe the same tool: an outline of the body that someone marks to show where something is felt.
A free body diagram is a physics and engineering drawing that shows the forces acting on an object. A body chart is a clinical record of where a client feels symptoms. The two share a name and nothing else.
Both, in different colors. In the pain drawing method, patients shade the areas where they feel pain themselves (Persson et al.). You then add what you found on examination in a second color, so anyone reading the chart can tell the client's report from your findings.
Update it whenever the symptom it records is still part of the reason the client is seeing you. If you set review visits, draw a fresh chart at each one and keep the earlier versions, because the comparison is where the chart earns its place.
Yes. Practice Better's Image Annotation lets you make notes directly on any image you add to a client record, using a toolbar to mark up areas, add measurements, draw, and take notes you can refer back to (top time-saving features). Practice Better also lists marking up diagrams, scans, or charts in your session records among its features (what we've built together).
Copy the layout and legend above, adjust the views to your discipline, and decide on your color key before your next new client. Then keep the chart in the same place as the session note it supports.
Start a free trial of Practice Better to annotate body diagrams in your client records and keep them alongside your session notes.
{{general-template-library-simple-text}}
{{free-trial-simple-text}}

Body charting is recording a client's symptoms on an outline drawing of the human body, so the location, spread, and type of each symptom sit in the record as a picture. The standard form is a line drawing with front and back views, where the client shades the areas they feel pain or marks them with colors or symbols (Persson et al., Journal of Pain Research). The same research describes pain drawings as a tool for the assessment, diagnosis, and documentation of pain conditions.
This guide gives you a template layout to copy, five worked examples from chiropractic, massage therapy, functional medicine and naturopathy, nutrition, and mental health, and the steps to build your own chart into your notes.
Every example here is illustrative. The clients are composites written to show the format, and none is a real person or a real record.
A body map is two outlines of the body, front and back, side by side on one page, with a legend in the margin and space for notes. The client or practitioner marks the outlines, and the legend tells the reader what each mark means.
Here is the layout this guide uses. Copy it as is, or adjust the views and legend to your work.
| Area of the chart | What goes there |
|---|---|
| Header | Client name, date, visit type, and who marked the chart |
| Front and back outlines | The marks themselves |
| Legend | One symbol per sensation, printed on the page |
| Color key | Client marks in one color, your findings in another |
| Intensity column | A 0 to 10 rating beside each marked area |
| Behavior column | Constant or comes and goes, plus what makes it better or worse |
| Linked note | The session note the chart belongs to |
Side views, hands, feet, and the face are optional extra outlines. Add them when your work involves those areas in detail. Empty outlines invite guessing.
Four things go on a body chart: where the symptom is, what it feels like, how strong it is, and how it behaves. The outline handles location. The legend handles the type of sensation. The two columns handle intensity and behavior.
A legend you can start from:
| Symbol | Meaning |
|---|---|
| Solid shading | Aching or dull pain |
| Dots | Numbness |
| Zigzag lines | Pins and needles or tingling |
| X | A specific tender point |
| Arrow | Symptom spreads in this direction |
| Tick mark | Area checked and clear |
The tick mark is the symbol we would argue for hardest. A tick over the leg tells the next reader you asked and the client said it was clear. Without it, a blank leg could mean either.
Whatever legend you pick, use it the same way for every client. A chart is only readable at a later visit, or by a colleague, when the symbols mean the same thing every time.
Each example below shows the scenario, what was marked on the chart, and the line in the session note that goes with it. The chart shows where. The note says what it means.
Composite scenario: first visit, lower back pain for six weeks.
Client marks (blue): solid shading across the right lower back. An arrow from the right buttock down the back of the right thigh, stopping above the knee. Zigzag lines on the outer right thigh.
Practitioner marks (red): an X over a tender point at the right side of the lower back. Tick marks over the neck, both arms, and the left leg.
Intensity and behavior: lower back 6 out of 10, constant. Thigh 4 out of 10, comes and goes, worse after sitting through a long drive.
Note line: "Body chart attached. Client-marked areas in blue, examination findings in red. Thigh symptoms reported as intermittent and linked by the client to prolonged sitting. Left leg, arms, and neck checked and clear."
The arrow and the stopping point matter here. Where a spreading symptom ends is a detail that is easy to lose in a written note and hard to lose on a drawing.
Composite scenario: returning client, booked for a 60-minute session.
Client marks (blue): circles over both upper shoulders and the left shoulder blade, labeled "work here." A crossed-out area on the right shin, labeled "avoid, bruised."
Pressure preference (written beside the outline): firm on the back, light on the neck.
Practitioner marks (red, after the session): shading over the areas worked. A note beside the left shoulder blade with the client's feedback during the session.
Note line: "Pre-session chart from client, post-session marks added. Right shin avoided at client request. Client reported the left shoulder blade area felt easier by the end of the session."
For a massage practice, the chart does two jobs. Before the session it is the client's instructions. After the session it is your record of what you did, in the same picture.
Composite scenario: joint pain and a skin rash, compared across a first visit and a review visit.
| First visit | Review visit | |
|---|---|---|
| Hands | Shading over three finger joints on each hand | Shading over one finger joint on each hand |
| Right knee | Solid shading, 5 out of 10 | Solid shading, 5 out of 10 |
| Forearms | Dotted outline of a rash on both forearms | Smaller outline on the left forearm only |
Note line: "Review chart compared with first-visit chart. Fewer painful finger joints marked by the client on both hands. Knee unchanged. Rash area reduced and now marked on the left forearm only."
This is where body charting pays off for practices that see clients over months. Two charts side by side show a change the client can see for themselves, and that makes the review conversation concrete. If symptoms in several body systems are part of your intake, a chart puts them on one page.
Composite scenario: digestive symptoms, second visit.
Client marks (blue): shading over the upper abdomen labeled "bloating, afternoons." A circle over the lower left abdomen labeled "cramping, mornings."
Intensity and behavior: bloating 5 out of 10, comes and goes. Cramping 3 out of 10, comes and goes.
Note line: "Abdominal body chart attached. Two distinct areas and timings marked by the client. Compare against the client's food journal for the same two weeks before the next visit."
A body chart and a food journal answer different questions. The chart records where and when a symptom shows up, and the journal records what was eaten. Putting them side by side is how you look for a pattern. If you already use a journal with clients, tracking client progress with a food and mood journal covers how to set one up.
Composite scenario: a client working on anxiety around presenting at work.
Client marks (blue): shading over the chest, throat, and stomach, drawn while describing the morning of a recent presentation.
At session six (green, on a fresh outline): shading over the chest only, lighter.
Note line: "Client completed a body map of where they notice anxiety before presenting. Repeated at session six. Client marked a smaller area and described it as less intense."
Asking people to color in where they feel something on a body outline is also a research method. A study published in PNAS had 701 participants color body silhouettes to show where they felt activity increase or decrease during different emotions (Nummenmaa et al., Bodily maps of emotions). If your approach includes somatic work, the same outline gives clients a way to show you what they find hard to put into words.
You build a body chart template in six steps: choose your views, write a legend, decide who marks first, add intensity and behavior fields, attach the chart to the session note, and compare charts at each review.
The written note still carries the reasoning. If you chart in SOAP, the body chart supports the subjective and objective sections, and the assessment explains what the marks add up to. For worked notes in that format, see SOAP note examples, and for the mechanics, how to write a SOAP note.
You body chart in Practice Better by adding a body diagram image to the client record and marking it up with Image Annotation. The feature lets you make notes directly on any image you add to client records, using a toolbar to mark up areas, add measurements, draw, and take notes you can refer back to (top time-saving features). Practice Better also lists marking up diagrams, scans, or charts in your session records among its features (what we've built together).
The chart then sits inside the same record as the rest of your documentation. Practice Better's charting tools support SOAP, ADIME, DAP, BIRP, or a custom note format built from scratch, and let you attach protocols, labs, and tasks directly to session notes. Its template library is searchable by profession and by format, and every pricing plan includes full access to the form and note templates. For setting up the note side, how practitioners unlock note templates walks through it.
You will see them called body charts, body diagrams, body maps, and pain drawings. Pain drawing is the term pain researchers use (Persson et al.), and body map is the term used in research on where people feel emotions in the body (Nummenmaa et al.). They all describe the same tool: an outline of the body that someone marks to show where something is felt.
A free body diagram is a physics and engineering drawing that shows the forces acting on an object. A body chart is a clinical record of where a client feels symptoms. The two share a name and nothing else.
Both, in different colors. In the pain drawing method, patients shade the areas where they feel pain themselves (Persson et al.). You then add what you found on examination in a second color, so anyone reading the chart can tell the client's report from your findings.
Update it whenever the symptom it records is still part of the reason the client is seeing you. If you set review visits, draw a fresh chart at each one and keep the earlier versions, because the comparison is where the chart earns its place.
Yes. Practice Better's Image Annotation lets you make notes directly on any image you add to a client record, using a toolbar to mark up areas, add measurements, draw, and take notes you can refer back to (top time-saving features). Practice Better also lists marking up diagrams, scans, or charts in your session records among its features (what we've built together).
Copy the layout and legend above, adjust the views to your discipline, and decide on your color key before your next new client. Then keep the chart in the same place as the session note it supports.
Start a free trial of Practice Better to annotate body diagrams in your client records and keep them alongside your session notes.
{{general-template-library-simple-text}}
{{free-trial-simple-text}}



.jpg)